Technical analysis (TA) is the study of the price behavior of a specific asset using past price data and price chart patterns to make trading decisions with a short investment horizon based on trends. Long-term investors also use technical indicators to find suitable entry and exit points.
Technical analysts, also called technicians or chartists, primarily examine price data and volume, among other information, to measure market sentiment or traders’ feelings about the state of the market, bullish or bearish. They analyze price changes occurring during a specific timeframe: hour to hour, day to day, or week to week and identify patterns that could predict future price movement and initiate trading signals.
Table of Contents
History repeats itself
One of the assumptions of technical analysis is that the history of price action tends to repeat itself. After all, the market consists of human beings whose emotions are predictable and drivers of price action. If past price action is the result of human behavior and human behavior doesn’t change, then a future price action will resemble that of the past.
The trend is your friend
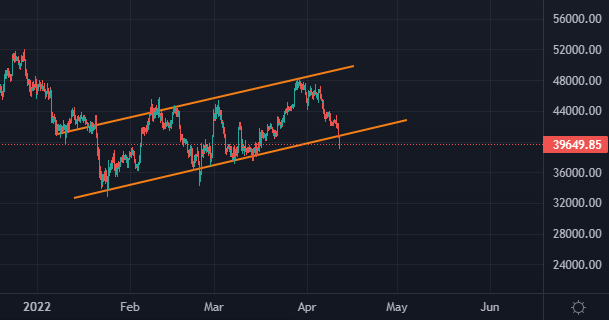
Another tenant of technical analysis is the tendency of price to move in trends in a zig zag-like pattern. The price of an asset can move in an upward trend, creating a higher high and lower high, or in a downward trend, creating a lower and lower high, or it can move sideways (flat). An existing trend is likely to continue until it reaches a pivot point of support or resistance where the price could reverse and change direction.
Support and resistance
Support is the level where the price is expected to bounce after falling at a predetermined price, while resistance is the opposite. A trend may continue its one-way direction, resulting in a break-out situation where the price penetrates support and resistance. Support and resistance levels are commonly used in short time frames by day traders, who sell resistance and buy support.
Patterns
Patterns are shaps produced as a result of price action. They can be continuation or reversal patterns. Pattern types include triangles, pennants, rectangles, and flags. Other types include head and shoulders, double and triple tops and bottoms, and cup and handle. These patterns can be bullish or bearish. They help traders make a trading decision along with using other indicators.
Volume
Besides price, volume is one of the essential components of technical analysis. Volume is the number of shares or coins traded or exchanged hands over a specific time period. It helps determine the strength or weakness of a trend and whether it is likely to continue or reverse, relying on volume-based technical indicators.
Momentum
Momentum is the rate of change of price or the speed at which the price moves in one direction over a period of time. Momentum also helps traders determine the strength of a trend and use momentum indicators to measure its strength.
Technical indicators
The market price is determined by the forces of demand and supply or the interaction between buyers and sellers. Technical indicators can predict changes in the dynamics of demand and supply and hence buying and selling behavior of market participants. Technical indicators are math-based models derived from historical price changes. Analysts use them to time entry and exit in and out of the market.
The most popular and commonly used indicators are Bollinger Bands (BB), Moving averages, MACD, and RSI. The RSI, for example, can help traders display momentum-based entry and exit points by determining whether an asset or security is overbought or oversold.
Types of technical indicators
Trend indicators
- Moving Average Convergence-Divergence (MACD)
- Moving averages
- Know Sure Thing (KST) Oscillator
- Parabolic SAR
Momentum indicators
- Relative Strength Index (RSI)
- Stochastic oscillator
- Williams %R
Volatility indicators
- Bollinger Bands
- Donchian channel
- Average True Range
Volume indicators
- Accumulation/distribution Index
- Money Flow Index
- On-balance Volume
Types of charts
Charts depict the past and current price action of the market in multiple formats:
- Line
- Bar
- Candlesticks
- O-H-L-C
Candlesticks are the most commonly used to present the price on the charts. The candle has a top, bottom, and body. The top of the candle marks the highest price point while the bottom is the lowest. The upper body of the candle marks the opening price, while the bottom marks the closing price.
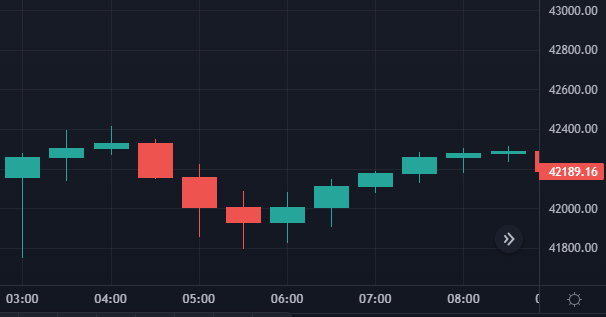
One candle contains information about the price action over a specific time period e.g. one minute, hour, day, week, or month. Candle patterns and shapes can also help traders also relays on candle patterns and shapes to identify trend reversals or continuations.
Charting on different time frames
Traders can view the past and current price action using the different time frames. The 4-hour time frame is the most commonly used for short-time trading. Other time frames include:
- 5-minute chart
- 15-minute chart
- 30-minute chart
- Hourly chart
- 2-hour chart
- 12-hour chart
- Daily chart
- Weekly chart
Conclusion
Technical analysis teaches traders to use historical price data to find profitable trading opportunities. While this idea is simple to understand, technical analysis has so much width and depth, covering a wide array of subjects, including math, statistics, psychology, and finance. Technical analysis has merits, but keep in mind that some discount its effectiveness and usefulness.