One of the trader’s oldest and most reliable tools is support and resistance levels. Market participants need a pricing model to understand whether it is profitable to buy or sell at a given point in time. However, it is not always possible to determine the right time to enter a position. Fibonacci helps to solve this problem.
Table of Contents
Fibonacci sequence
The Fibonacci sequence was named after Leonardo Fibonacci, an Italian mathematician born in 1170. Each number in the sequence is equal to the sum of the last two numbers. It begins with 0 and 1 and then continues as 1, 2, 3, 5, 8, 13, 21, 34, 55, 89, 144, 233, etc.
When dividing the numbers closest to each other, for instance, 34/55, 55/89, 89/144, etc., the result is a Fibonacci ratio of 0.618, also known as the Golden Ratio. By skipping a number when dividing, the result becomes a consistent ratio close to 0.382, such as 13/34 = 21/55 = 34/89, etc.
Fibonacci ratios presented as percentages help traders determine levels of support and resistance during price correction. It also aids in spotting the end of a downward trend and the start of an upward one.
Fibonacci Retracement
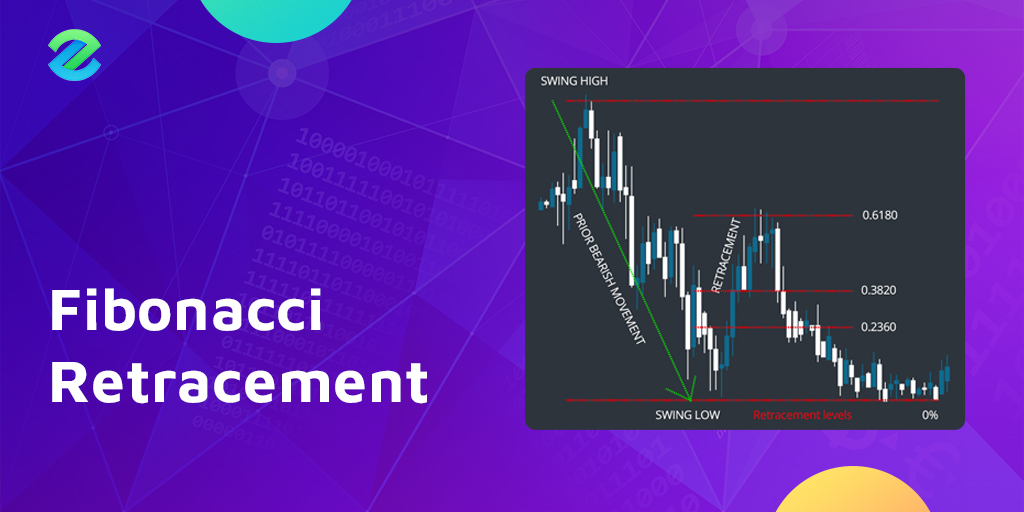
Traders use the Fibonacci retracement tool to determine how deep the price will retrace or correct as it moves on an upward or downward trend. The most common Fibonacci retracement levels include 23.6%, 38.2%, 50%, 61.8%, and 78.6%, all derived from the Fibonacci numbers sequence. The most important level for retracement is 61.8. When the price breaks this level, a new trend is more likely to form in the opposite direction.
Let’s clear this further. The price trend does not move in a straight line. As it travels upward or downward, it makes pullbacks or retracements. Traders use the Fibonacci Retracement tool to measure the short-term price correction during an upward or downward trend.
Traders plot the Fibonacci retracement tool by dragging where the trends begin. The retracements level extends from 0 to 100% and divides into lines of support and resistance based on the Fibonacci number sequence: 23.6%, 38.2%, 50%, 61.8%, and 78.6%.
When the price is going up, it should correct and pull back to at one of these levels before it counties its upward momentum. The same applies when the price is heading to the downside. It should correct at one of these levels before it continues going down.